Why test a trade in context?
A trade can look reasonable on its own and still add exposure you already have. If you own SOFI shares and are considering another short SOFI put, the trade’s payoff alone does not show their combined sensitivity to SOFI’s price.
Scenario Lab starts with the portfolio you select, adds a hypothetical trade, and compares supported before-and-after estimates. You can see how cash and exposure change without recording a real trade.
It is a Premium product tool for examining a decision, not a recommendation to buy, sell, keep, or roll.
Choose the starting portfolio
Open Scenario Lab and choose the portfolio under Portfolio to test against. Its existing positions and known cash form the “before.” Your assumed trade creates the “after.”
Make sure you selected the portfolio you intended and that its recorded positions and activity are current. A missing holding cannot contribute to the comparison; missing quotes or contract terms can make parts of the result unavailable.
After analysis, check the displayed portfolio name and reference time. A saved scenario keeps its reviewed baseline. Reopening it does not silently replace that baseline with today’s portfolio.
Build or bring in a possible trade
In Hypothetical Trade, choose Stock or Option, enter the ticker, action, quantity, and assumed price. Options also need call or put, strike, and expiration. Add stock or option adds another component, up to 10 legs.
Buy to Open / Sell to Open create hypothetical holdings. Buy to Close / Sell to Close model reducing a matching existing holding and must match supported source quantity. A Roll Assistant handoff supplies the selected close and new open together.
You can also arrive from supported Discovery or Screener candidates. Inspect imported quantity, contract, and assumed price before using Analyze Scenario.
- Bid / Mid / Ask
- Choose an available quote as an assumed price. Mid is halfway between bid and ask; quoted prices are not guaranteed fills.
- Custom
- Enter your own assumed fill. Refreshing market data preserves Custom prices; refresh does not claim your assumption is executable.
- Refresh market data
- Request available prices and contract details. When the market is closed, a reference price remains a disclosed assumption. Analyze again to update changed trade inputs.
Read current versus scenario
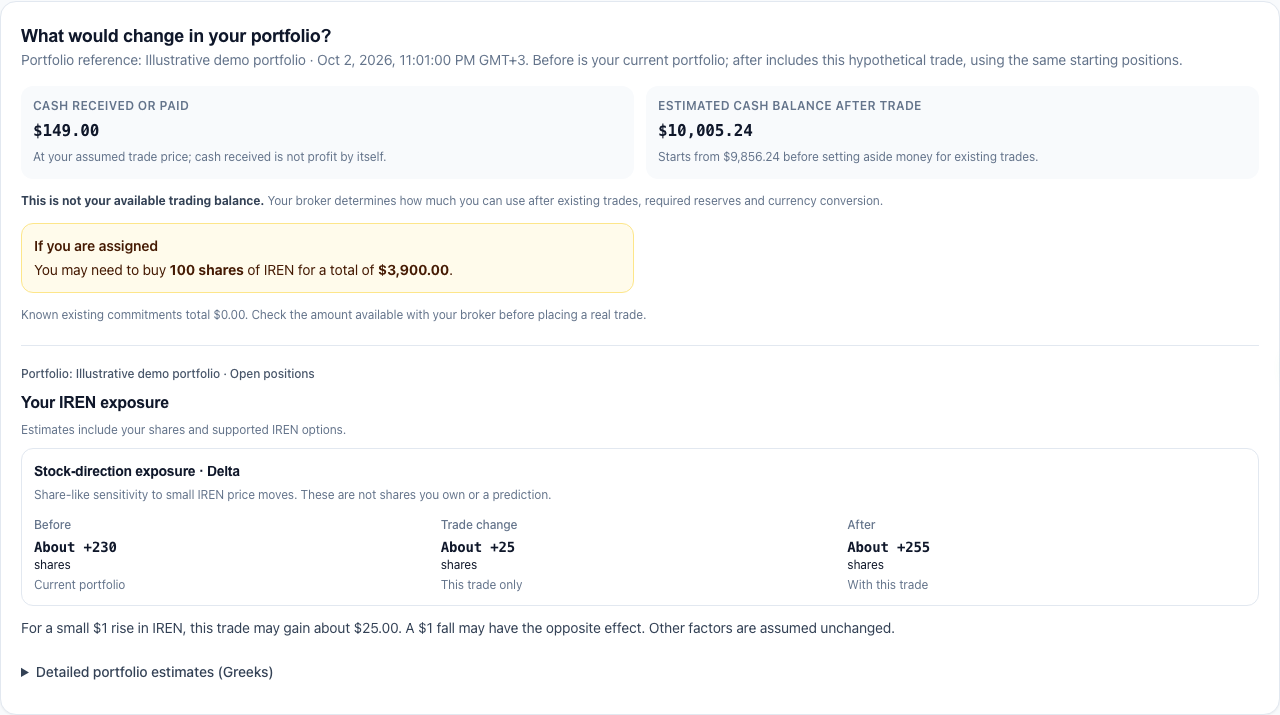
Start with the trade summary: what is bought or sold, and what the assumed fill receives or costs. Then read What would change in your portfolio? using the same starting portfolio on both sides.
- Before
- The selected real portfolio snapshot, before adding the possible trade.
- Trade change
- The estimated difference created by the hypothetical trade, including supported closing offsets.
- After
- The estimated portfolio with that trade applied hypothetically.
The first layer shows the practical effect on your exposure. Expand the detailed Greek comparison for the numbers and coverage. Unavailable values are not zero; a partial subtotal is not your complete portfolio exposure.
Explore a stock-price outcome
When supported, Expiration Payoff & Outcomes shows this trade’s profit or loss across stock prices at expiration, before fees. It describes the hypothetical trade, not the future value of your whole portfolio.
For example, if SOFI’s reference price is $15.75, enter a target of $18 to ask: “What would this trade’s result be if SOFI were $18 at expiration?” The target is a what-if input, not a forecast or a change to the underlying used in the portfolio baseline.
Breakeven is where the trade’s expiration profit/loss is zero under the assumed fills. Max profit and max loss describe supported payoff bounds; unavailable or unlimited values are shown explicitly. Inspect the full-downside view when offered so a narrow chart range does not hide the price-zero outcome.
A stock-only trade has a stock-price outcome without an invented expiration. Closing actions, different expirations, unrelated underlyings, or unsupported contract terms can make a single-expiration option payoff unavailable.
Understand time and volatility limits
The current editor does not have an arbitrary future-date control or an implied-volatility shock input. The expiration target-price view is not a “seven days from now” repricing model.
Theta describes estimated daily time sensitivity, and Vega describes estimated sensitivity to a one-percentage-point change in implied volatility. Neither applies a scenario shock by itself or predicts an actual future price.
Saved price updates, where available, follow later market observations. They show what changed in the market; they do not simulate a date or volatility level you choose.
Interpret the exposure
- Delta · stock-direction exposure
- Estimates sensitivity to a small stock-price move, holding other factors constant. Shares and supported options on the same stock can be expressed as approximate share-equivalent exposure. Those equivalent shares are not actual shares you own.
- Gamma · change in Delta
- Estimates how much Delta changes for a $1 move in that stock. A larger absolute Gamma means directional sensitivity can change more quickly; it does not tell you the direction the stock will move.
- Theta · daily time-decay exposure
- Estimates the value change from one day passing with other factors held constant. Positive Theta is not daily income or guaranteed profit.
- Vega · volatility exposure
- Estimates the value change for a one-percentage-point move in implied volatility, holding other factors constant. Volatility can change differently for different options.
Delta and Gamma stay per stock because a $1 move in SOFI is not a $1 move in another ticker. Theta and Vega can be combined only with compatible currency and units. Missing, stale, estimated, or excluded holdings remain disclosed.
A positive Delta suggests positive sensitivity to a small price rise in that stock; it does not guarantee profit. Near-zero Delta still leaves possible Gamma, volatility, time, and other risks.
For background on these sensitivities, see the Options Industry Council’s option Greeks guide.
Read cash and concentration carefully
Cash received or paid is the net cash flow at your assumed stock and option fills. Estimated cash balance after trade starts from known portfolio cash before setting aside reserves for existing trades. Cash received is not profit by itself.
Illustrative example: $5,000 accounting cash plus $125 received for a hypothetical short put becomes $5,125. If that standard put has a $16.50 strike and a 100-share deliverable, assignment could still require buying $1,650 of stock. The extra $125 does not remove that obligation.
The broker decides your available trading funds and margin. Accounting cash and supported assignment amounts are not broker buying power; unknown commitments and currency limits remain visible.
Stock market-value concentration, when a supported change is shown, uses stock holdings only. It does not include possible future option assignment or exercise. To examine added option exposure on a ticker you already own, use its Delta/Gamma comparison rather than treating that stock-only percentage as total risk.
Save and revisit a scenario
- Save Scenario
- Keep the analyzed inputs, assumed prices, and portfolio baseline to reopen later without requesting ongoing price updates.
- Save & Track
- Save the hypothesis and follow price updates when the trade, account, market-data coverage, and collection settings allow it. Availability is shown in the product; automatic updates are not guaranteed.
- Saved scenarios
- Open an existing entry, rename it, duplicate it, or delete it. A duplicate gives you a separate copy to investigate. Use the current-portfolio copy action when offered to test against an updated baseline.
- Refresh and analyze again
- Refresh market data, review your assumed prices, and analyze changed inputs. Reanalyzing or changing the baseline of a saved hypothesis creates a new reviewed version rather than rewriting its original history.
The original analysis, its portfolio baseline, and later observed prices answer different questions. Saving, refreshing, duplicating, or deleting a scenario does not add, edit, or close a real portfolio position.
Bring a roll into the portfolio
- Start with an existing supported option position.
- Use Roll Assistant to compare time, strike, estimated money received or paid, and exposure.
- Select one alternative to investigate and choose See portfolio impact.
- Review the hypothetical closing and opening actions in Scenario Lab. The selected existing option is offset once; unrelated holdings stay in the baseline.
- Read supported cash and exposure changes, save if useful, and decide what to do yourself.
A roll with different expirations or closing actions cannot use the single-expiration payoff chart. Its supported portfolio impact can still help you understand what the roll changes.
Optional later step: manual IBKR preparation
Supported scenarios can prepare reviewable manual instructions after a coherent analysis and the required broker, contract, and quote checks. Rolls and multi-leg trades require manual combination review. A BasketTrader CSV is offered only for eligible single-leg orders; Optioneer does not export a spread or roll as unrelated CSV rows.
Optioneer does not transmit the order. You review all contract, quantity, action, price, and account details in IBKR and decide whether to place it yourself.
Limits and common questions
These are hypothetical estimates, not predictions or investment advice. Market data changes, fills can differ from assumed prices, and some payoff or exposure fields may be unavailable. There is no automatic trading.
Does Analyze Scenario add a real trade?
No. Analysis, saving, and tracking stay separate from your real positions and transactions.
Does the target stock price reprice my whole portfolio?
No. The supported target-price view shows this trade’s payoff outcome. Before/after portfolio impact uses the reviewed baseline and fill assumptions.
Why does my roll have no payoff graph?
The expiration payoff view requires a supported single-expiration setup. Closing legs and different expirations do not have one such graph; supported cash and exposure comparisons remain available.
Can positive Theta tell me what I will earn next week?
No. Theta is a local time sensitivity with other factors held constant. Stock prices, volatility, and the Greeks themselves can change.
Why is an estimate partial or unavailable?
Some holdings may lack reliable prices, Greeks, currency, or validated contract terms. Review coverage and warnings; missing values are not zero.
Will Save & Track always update automatically?
No. Updates depend on eligibility, provider data, market conditions, and enabled collection. The saved analysis remains available when tracking is unavailable.
Can Optioneer submit an IBKR order for me?
No. Eligible instructions or CSV exports are a manual handoff; you review and transmit an order yourself in IBKR.